Introduction
I am currently taking a very interesting course on Mixture Models on Coursera from the UC of Santa Cruz:
https://www.coursera.org/learn/mixture-models
One example discussed the higher flexibility of these models for classification tasks as compared to other methods like K-Means.
A mixture model allows modeling a flexible probability distribution using $K$ weighted components of different probability distributions $g_k$ (density function), which can come from various distribution families.
Density function of mixture model:
$f(x)= \sum_{k=1}^{K} w_k \cdot g_k(x)$
This essentially means, that if the individual components and their weights are choosen carefully, it allows a high flexibility on modeling the probability distribution of a given data set.
Mixture models can also be used for clustering/classification tasks for unsupervised learning, since each class can be represented by a corresponding component in the mixture model.
A commonly used mixture model is the GMM, which considers only Gaussian Components. E.g. for the univariate case:
$f(x)= \sum_{k=1}^{K} w_k \cdot \frac{1}{\sqrt{2\pi}\sigma_k}\exp\{-\frac{1}{2\sigma_k^2}(x-\mu_k)^2\}$
and an additional specification about the shape of the distributions via the covariance matrix of the features in the multi-variate case.
Limitations when using K-Means
K-Means is in fact very similar to a GMM with the following assumptions:
- Features are uncorrelated (Corresponds to a spherical shaped cluster)
- Same variance across classes (All cluster spheres of equal diameter)
- Prefers same amount of observations in each class
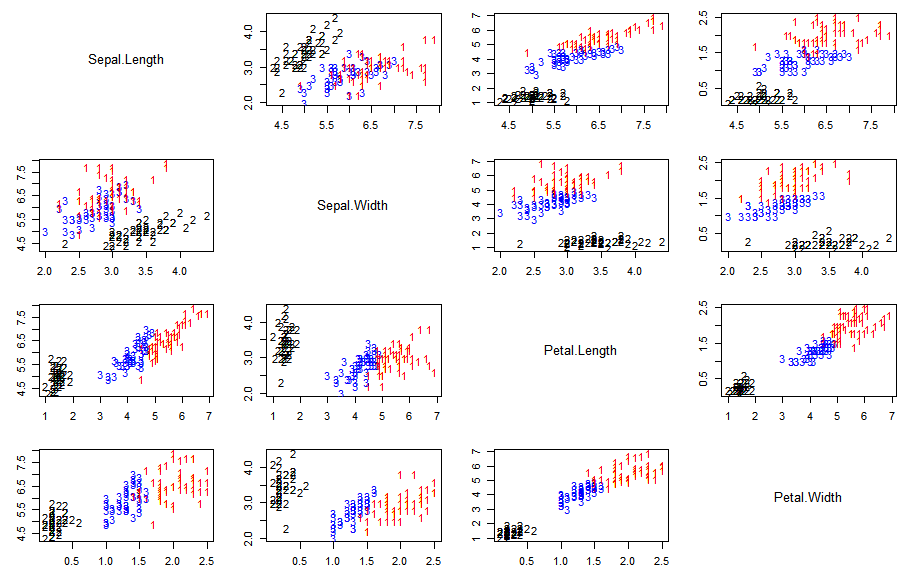
The limitations of the method can be for example shown using the iris data set with the following true classes/species (setosa: black, versicolor: blue, virginica: red) across the 4 features (Sepal.Length, Sepal.Width, Petal.Length, Petal.Width):

The data set shows that there are strong correlations between the different features depending on the classes. E.g. versicolor (blue) and virginica (red) have a strong correlation between Sepal.Length and Petal.Length while for setosa (black) there appears to be no correlation for these features.
This means that K-Means generates a classification that can reasonably classify the setosa (black) species, but the accuracy for versicolor (blue) and virginica (red) is limited due to the method assumptions.
Classification using K-Means:

The adjusted Rand index (https://www.rdocumentation.org/packages/mclust/versions/5.4.6/topics/adjustedRandIndex) as a measure of classification accuracy is approx. 0.73 here.
Higher flexibility using Mixture Models
The limitations of K-Means can be addressed by allowing a fully flexible covariance matrix using a mixture model with three (multi-variate) Gaussian components. It should also be noted that cases of unequal observations among different classes/components can be represented by the weights $w_k$. This wouldn’t be possible with K-Means. The common algorithm for fitting the mixture model parameters is the Expectation Maximization algorithm.
Classification using Mixture Model with three (multi-variate) Gaussian components and full parameter flexibility:
The adjusted Rand index of this mixture model is approx. 0.90 compared to 0.73 using K-Means, which indicates a much better fit with the true labels.
GMM in Python using Scikit-learn
GMM’s and the EM algorithm in particular are available also within the scikit-learn package: https://scikit-learn.org/stable/modules/generated/sklearn.mixture.GaussianMixture.html#sklearn.mixture.GaussianMixture
However, I recommend checking out the course on Coursera specifically because it contains a derivation of the EM algorithm for any form mixtures (in R). This way it is possible to model e.g. zero inflated data or other special type of data sets.
Source code generating the images can be found in the course materials: https://www.coursera.org/learn/mixture-models